파일:WeierstrassFunction.svg
둘러보기로 이동
검색으로 이동

SVG 파일의 PNG 형식의 미리보기 크기: 795 × 505 픽셀. 다른 해상도: 320 × 203 픽셀 | 640 × 407 픽셀 | 1,024 × 650 픽셀 | 1,280 × 813 픽셀 | 2,560 × 1,626 픽셀
원본 파일 (SVG 파일, 실제 크기 795 × 505 픽셀, 파일 크기: 120 KB)
파일 설명
| 설명 |
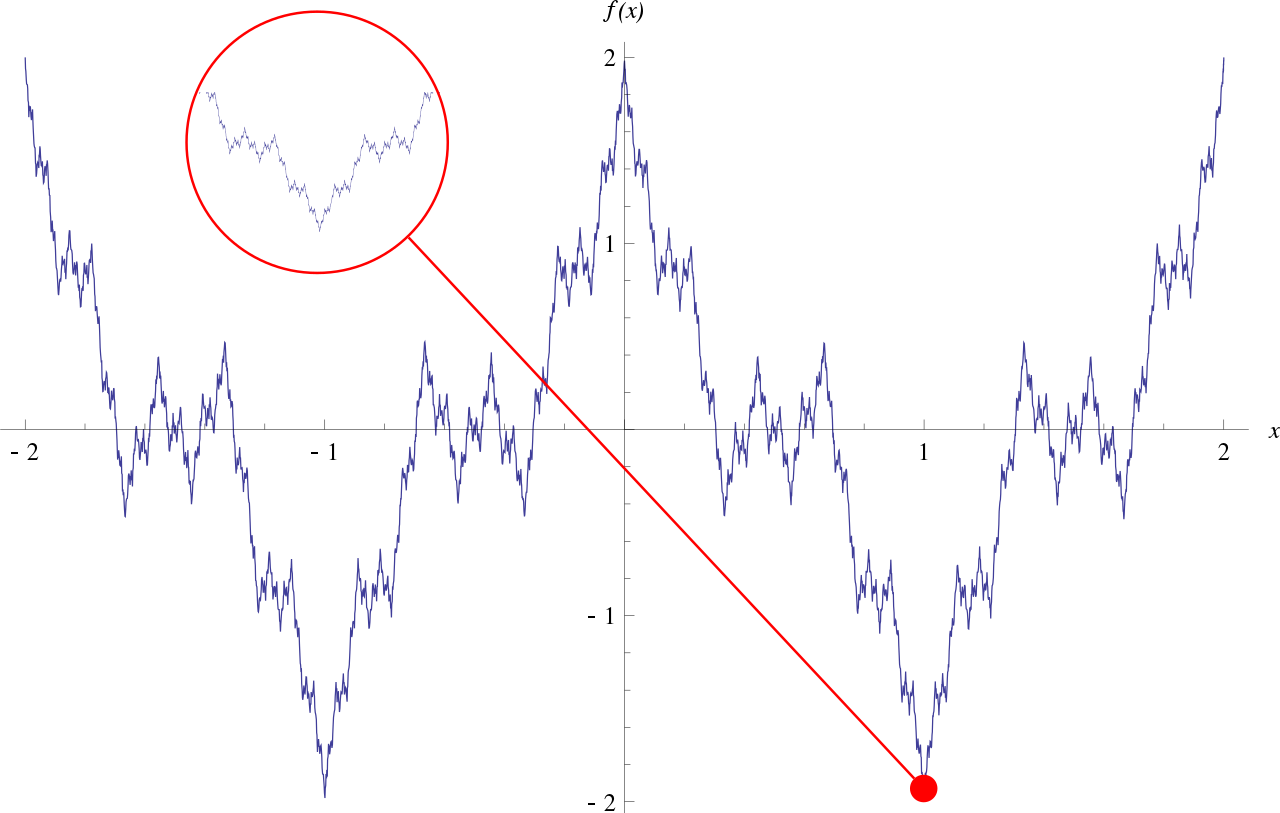
English: Plot of the Weierstrass function. A section of the plot is zoomed in on to illustrate the fractal nature of the function. The plot was generated using Mathematica and exported to SVG. I first made a plot of the region and then a plot of a much smaller section around the red point on the image. With the use of Inkscape, I was able to put the two in the same SVG file. This file is an Inkscape SVG, not a plain SVG. |
| 날짜 | |
| 출처 | 자작 |
| 저자 | Eeyore22 |
| 다른 버전 | File:Weierstrass_function.gif |
라이선스
| 나는 이 작품의 저작권자로서, 이 작품을 퍼블릭 도메인으로 모두에게 공개합니다. 이 공개 선언은 전 세계적으로 유효합니다. 만약 저작권의 포기가 법률적으로 가능하지 않은 경우, 나는 이 작품을 법적으로 허용되는 한도 내에서 누구나 자유롭게 어떤 목적으로도 제한없이 사용할 수 있도록 허용합니다. |
파일 역사
날짜/시간 링크를 클릭하면 해당 시간의 파일을 볼 수 있습니다.
| 날짜/시간 | 섬네일 | 크기 | 사용자 | 설명 | |
|---|---|---|---|---|---|
| 현재 | 2008년 10월 27일 (월) 01:44 | | 795 × 505 (120 KB) | wikimediacommons>Eeyore22~commonswiki | {{Information |Description={{en|1=Plot of the Weierstrass function. A section of the plot is zoomed in on to illustrate the fractal nature of the function.}} |Source=Own work by uploader |Author=Eeyore22 |Date=October 26, 2008 |Permissio |
이 파일을 사용하는 문서
다음 문서 2개가 이 파일을 사용하고 있습니다: