파일:Standard deviation diagram.svg
둘러보기로 이동
검색으로 이동

SVG 파일의 PNG 형식의 미리보기 크기: 400 × 200 픽셀. 다른 해상도: 320 × 160 픽셀 | 640 × 320 픽셀 | 1,024 × 512 픽셀 | 1,280 × 640 픽셀 | 2,560 × 1,280 픽셀
원본 파일 (SVG 파일, 실제 크기 400 × 200 픽셀, 파일 크기: 17 KB)
파일 설명
| 설명 |
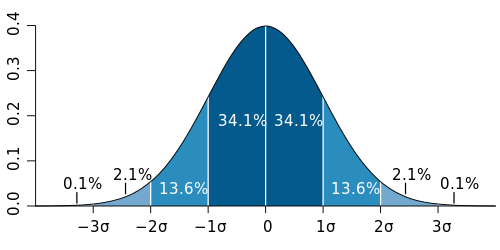
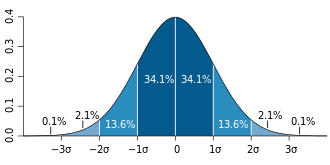
English: Normal distribution curve that illustrates standard deviations. Each band has 1 standard deviation, and the labels indicate the approximate proportion of area (note: these add up to 99.8%, and not 100% because of rounding for presentation.)
Français : Courbe de distribution normale montrant l'écart type. Chaque bande verticale a une largeur d'un écart type et les pourcentages indiquent leur valeur approximative rapportée à la population totale. Note : du fait des arrondis, le total est de 99,8 % au lieu de 100%. |
| 날짜 | |
| 출처 | 자작, based (in concept) on figure by Jeremy Kemp, on 2005-02-09 |
| 저자 | M. W. Toews |
| 다른 버전 |
|
.svg)
라이선스
이 파일은 크리에이티브 커먼즈 저작자표시 2.5 일반 라이선스로 배포됩니다.
- 이용자는 다음의 권리를 갖습니다:
- 공유 및 이용 – 저작물의 복제, 배포, 전시, 공연 및 공중송신
- 재창작 – 저작물의 개작, 수정, 2차적저작물 창작
- 다음과 같은 조건을 따라야 합니다:
- 저작자표시 – 적절한 저작자 표시를 제공하고, 라이선스에 대한 링크를 제공하고, 변경사항이 있는지를 표시해야 합니다. 당신은 합리적인 방식으로 표시할 수 있지만, 어떤 방식으로든 사용권 허가자가 당신 또는 당신의 사용을 지지하는 방식으로 표시할 수 없습니다.
파일 역사
날짜/시간 링크를 클릭하면 해당 시간의 파일을 볼 수 있습니다.
| 날짜/시간 | 섬네일 | 크기 | 사용자 | 설명 | |
|---|---|---|---|---|---|
| 현재 | 2015년 1월 15일 (목) 03:06 | | 400 × 200 (17 KB) | wikimediacommons>GliderMaven | Average is now zero not mu |