파일:Partition of unity illustration.svg
둘러보기로 이동
검색으로 이동

SVG 파일의 PNG 형식의 미리보기 크기: 800 × 132 픽셀. 다른 해상도: 320 × 53 픽셀 | 640 × 106 픽셀 | 1,024 × 169 픽셀 | 1,280 × 211 픽셀 | 2,560 × 422 픽셀 | 5,400 × 891 픽셀
원본 파일 (SVG 파일, 실제 크기 5,400 × 891 픽셀, 파일 크기: 12 KB)
파일 설명
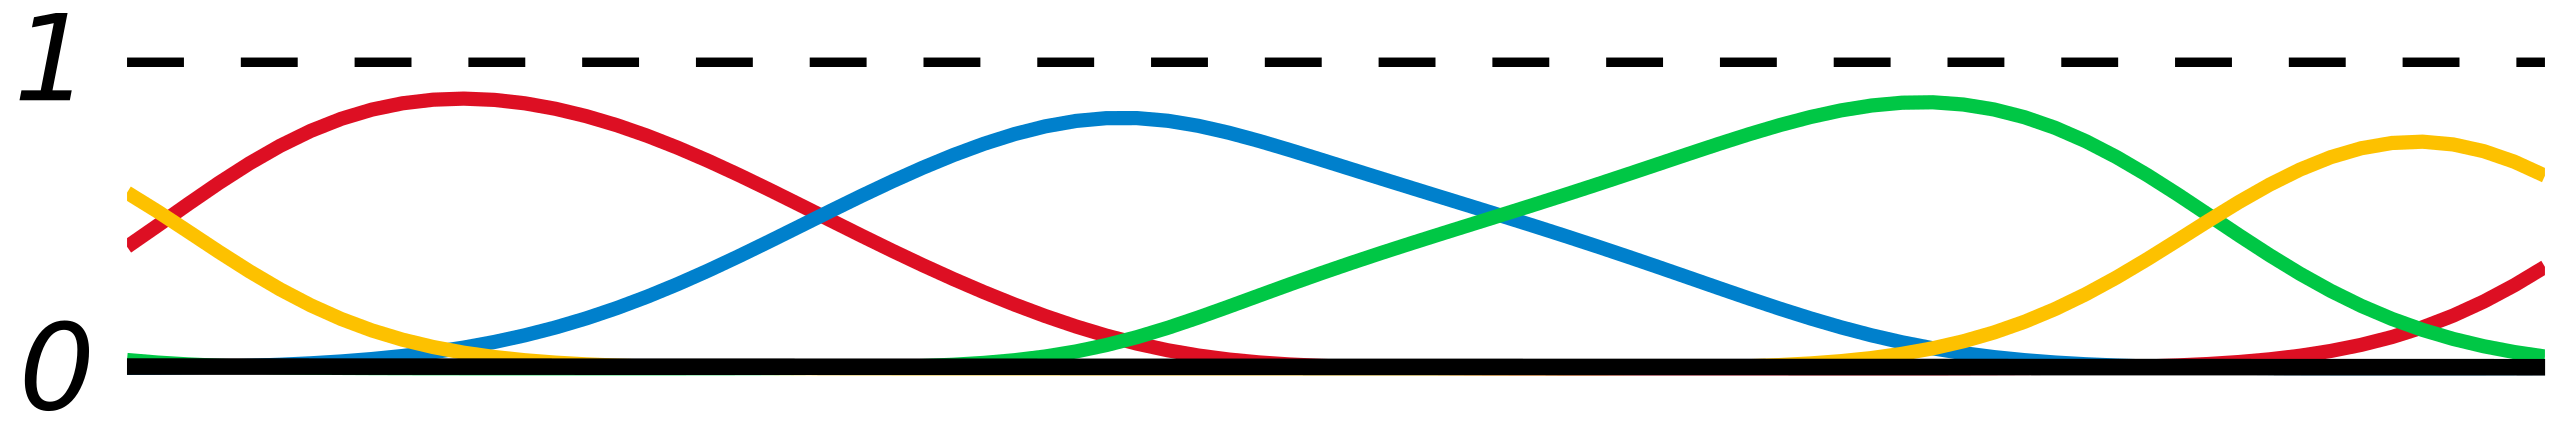
| 설명 | Illustration of Partition of unity |
| 날짜 | (UTC) |
| 출처 | self-made with MATLAB, tweaked in Inkscape |
| 저자 | Oleg Alexandrov |
| SVG 발전 |
라이선스
| 나는 이 작품의 저작권자로서, 이 작품을 퍼블릭 도메인으로 모두에게 공개합니다. 이 공개 선언은 전 세계적으로 유효합니다. 만약 저작권의 포기가 법률적으로 가능하지 않은 경우, 나는 이 작품을 법적으로 허용되는 한도 내에서 누구나 자유롭게 어떤 목적으로도 제한없이 사용할 수 있도록 허용합니다. |
Source code (MATLAB)
% illustration of partitition of unity.
% For simplicity, we cheat by using scaled sums of gaussians
% instead of bump functions.

function main()

   figure(1); clf; hold on; axis equal; axis off;
   lw = 2; % linewidth

   h=0.1; % grid size

%  endpoints of the interval
   a = -5; b = 10;

   Sample=[-2.1 -1.3 -0.4 1.3 1.8 3.1 4.5];

   red    = [0.867 0.06 0.14];
   blue   = [0, 129, 205]/256;
   green  = [0, 200,  70]/256;
   yellow = [254, 194,   0]/256;
   Colors = [red', blue', green', yellow']';

   L = [2 4 6 8];

   X=a:h:b;
   Y = zeros(length(L), length(X));
   Yt = 0*X;

   % gaussian with mean zero variance zsigma
   zsigma=0.55;
   f=inline('exp(-x.^2/2/zsigma)/zsigma/sqrt(2*pi)');

   pos = 1;
   for i=1:length(Sample)

      if i > L(pos)
         pos = pos+1;
      end

      Ycur = f(X-Sample(i), zsigma);
      Y(pos, :) = Y(pos, :) + Ycur;
      Yt = Yt+Ycur;

   end

   [Xtp, Ytp] = make_periodic (a, b, h, X, Yt);
   Yr = 0*Xtp;

   for pos=1:length(L)
      [Xp, Yp] = make_periodic (a, b, h, X, Y(pos, :));

      Yp = Yp./Ytp;
      Yr = Yr + Yp;
      plot(Xp, Yp, 'color',  Colors(pos, :), 'linewidth', lw);
   end

   plot(Xtp, 0*Yr, 'k', 'linewidth', lw);
   plot(Xtp, Yr, 'k', 'linewidth', lw/1.4, 'linestyle', '--');

   fs = 20;
   shiftx = -0.3;
   shifty = -0.0;

   text(Xtp(1)+shiftx, 0+shifty, '0', 'fontsize', fs);
   text(Xtp(1)+shiftx, 1+shifty, '1', 'fontsize', fs);

   saveas(gcf, 'Partition_of_unity_illustration.eps', 'psc2');
   %plot2svg('Partition_of_unity_illustration.svg');

function [Xp, Yp] = make_periodic (a, b, h, X, Y)

%  Take a function defined on the real line.
%  Wrap the real line around. Sum the overlapping parts.
%  Get a periodic function.

   T = 8;
   as = -3; bs = as+T;
   A = (as-a)/h;
   B = (bs-a)/h;

   N = length(Y);

   Y((B-A+1):B) = Y((B-A+1):B) + Y(1:A);
   Y((A+1):(A+N-B)) = Y((A+1):(A+N-B)) + Y((B+1):N);

   Yp = Y((A+1):B);
   Xp = X((A+1):B);
파일 역사
날짜/시간 링크를 클릭하면 해당 시간의 파일을 볼 수 있습니다.
| 날짜/시간 | 섬네일 | 크기 | 사용자 | 설명 | |
|---|---|---|---|---|---|
| 현재 | 2007년 8월 9일 (목) 05:03 | 5,400 × 891 (12 KB) | wikimediacommons>Oleg Alexandrov | Fix bug |
이 파일을 사용하는 문서
다음 문서 1개가 이 파일을 사용하고 있습니다: