파일:Normal subgroup illustration.png
둘러보기로 이동
검색으로 이동
미리 보기 크기: 624 × 600 픽셀 다른 해상도: 250 × 240 픽셀 | 499 × 480 픽셀 | 648 × 623 픽셀
원본 파일 (648 × 623 픽셀, 파일 크기: 48 KB, MIME 종류: image/png)
Maksim 사용자가 en.wikipedia에서 공용으로 옮겨왔습니다.
The original description page was here. All following user names refer to en.wikipedia.

|
이 그림은 벡터 그래픽 버전(SVG)이 있습니다. 래스터(비트맵) 그림 대신 벡터 그래픽 그림을 사용하는 것이 좋습니다.
File:Normal subgroup illustration.png → File:Normal subgroup illustration.svg
|
 |
파일 설명
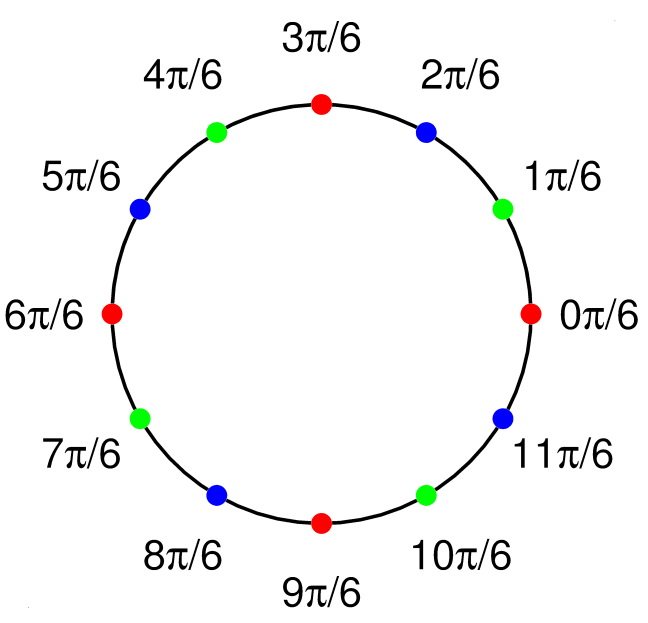
Made by myself with Matlab
라이선스
| 나는 이 작품의 저작권자로서, 이 작품을 퍼블릭 도메인으로 모두에게 공개합니다. 이 공개 선언은 전 세계적으로 유효합니다. 만약 저작권의 포기가 법률적으로 가능하지 않은 경우, 나는 이 작품을 법적으로 허용되는 한도 내에서 누구나 자유롭게 어떤 목적으로도 제한없이 사용할 수 있도록 허용합니다. |
Source code
function main ()

N=12; line_thickness=2.2; font_size=25; d=0.13; big_rad=10; ball_rad=0.5; ii=sqrt(-1);
red=[1, 0, 0]; green=[0, 1, 0]; blue=[0, 0, 1];
All=[red' green' blue'];

figure(1); clf; hold on; axis equal; axis off;

Theta=0:0.1:3*pi;
X=big_rad*cos(Theta);
Y=big_rad*sin(Theta);
plot(X, Y, 'linewidth', line_thickness, 'color', [0 0 0]);

for i=0:(N-1)
   z=big_rad*exp(i*ii*2*pi/N);
   place_text_smartly (z, font_size, i, d, sprintf('%d\\pi/%d', i, N/2), N);
   color_ball(real(z), imag(z), ball_rad, All(:, mod(i, 3)+1)');
end

scale=1.4;plot(scale*big_rad,  scale*big_rad)
scale=-1.4;plot(scale*big_rad,  scale*big_rad)

saveas(gcf, 'Normal_subgroup_illustration.eps', 'psc2')
saveas(gcf, 'Normal_subgroup_illustration.png')

function place_text_smartly (z, font_size, pos, d, tx, N)
 p=cos(2*pi/N)+sqrt(-1)*sin(2*pi/N);
 z = z + p^pos * d * font_size;
 shiftx=0.0003; shifty=0.03;
 x = real (z); y=imag(z);
 H=text(x+shiftx*font_size, y+shifty*font_size, tx);
 set(H, 'fontsize', font_size, 'HorizontalAlignment', 'c', 'VerticalAlignment', 'c')

 function color_ball(x, y, r, color)
    Theta=0:0.1:2*pi;
    X=r*cos(Theta)+x;
    Y=r*sin(Theta)+y;
    H=fill(X, Y, color);
    set(H, 'EdgeColor', 'none');
| date/time | username | edit summary |
|---|---|---|
| 13:19, 27 October 2005 | en:User:Oleg Alexandrov | (<span class="autocomment"><a href="/wiki/Image:Normal_subgroup_illustration.png#Source_code" title="Image:Normal subgroup illustration.png">→</a>Source code</span>) |
| 13:10, 27 October 2005 | en:User:Oleg Alexandrov | (<span class="autocomment"><a href="/wiki/Image:Normal_subgroup_illustration.png#Licensing" title="Image:Normal subgroup illustration.png">→</a>Licensing -</span> source code) |
| 12:42, 27 October 2005 | en:User:Oleg Alexandrov | (Made by myself with <a href="/wiki/Matlab" title="Matlab">Matlab</a>) |
기존 올리기 기록
Legend: (cur) = this is the current file, (del) = delete this old version, (rev) = revert to this old version.
Click on date to download the file or see the image uploaded on that date.
- (del) (cur) 13:18, 27 October 2005 . . en:User:Oleg_Alexandrov Oleg Alexandrov ( en:User_talk:Oleg_Alexandrov Talk) . . 648x623 (49214 bytes) (Made by myself with Matlab.)
파일 역사
날짜/시간 링크를 클릭하면 해당 시간의 파일을 볼 수 있습니다.
| 날짜/시간 | 섬네일 | 크기 | 사용자 | 설명 | |
|---|---|---|---|---|---|
| 현재 | 2006년 3월 20일 (월) 17:30 | | 648 × 623 (48 KB) | wikimediacommons>Maksim | La bildo estas kopiita de wikipedia:en. La originala priskribo estas: == Summary == Made by myself with Matlab == Licensing == {{PD-self}} == Source code== <pre><nowiki> function main () N=12; line_thickness=2.2; font_size=25; d=0.13; big_rad=10; |
이 파일을 사용하는 문서
이 파일을 사용하는 문서가 없습니다.